7.8 Robustness
Robustness is a parameter used to define the stability of the method against external influences. By external it is understood influences that are not inherent to the method model neither to departures from the documented operational procedure for the method. Such influences can be changes in environmental conditions, change in the staff performing the analysis or deterioration of the detector energy resolution, among others.
Robustness can be evaluated by periodic analysis of reference materials as part of the laboratory internal quality control actions. The interpretation of the results of IQC analyses depends on the concept of statistical control, which corresponds with the assumption of stability of operation. Statistical control implies that an IQC result x can be interpreted as arising independently and at random from a normal population with mean μ and variance σ2.
The variance of  in the absence of gross errors is given by:
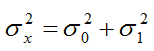
where  is the variance of the random uncertainty (within run)
and
is the variance of the random uncertainty (within run)
and  is the variance of the run effect. The variances of the
true value and of the persistent bias are both zero. An analytical system in control is fully described by
,
and the persistent bias. Under these constraints only about 0.3 % of results (x) would fall outside the bounds of
is the variance of the run effect. The variances of the
true value and of the persistent bias are both zero. An analytical system in control is fully described by
,
and the persistent bias. Under these constraints only about 0.3 % of results (x) would fall outside the bounds of
 (μ being the running average value). When such extreme
results are encountered, they are regarded as being "out-of-control" and interpreted to mean that the analytical system has
started to behave differently. Loss of control implies that the obtained results are of unknown trueness and precision
and hence cannot be relied upon.
(μ being the running average value). When such extreme
results are encountered, they are regarded as being "out-of-control" and interpreted to mean that the analytical system has
started to behave differently. Loss of control implies that the obtained results are of unknown trueness and precision
and hence cannot be relied upon.
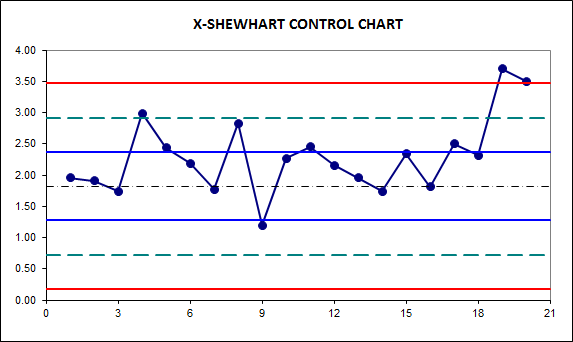
The measurements from these periodic measurements can be recorded in Shewhart charts. A Shewhart control chart is obtained
when values of calculated elemental mass fractions from a control material measured in consecutive runs are plotted on a vertical
axis against the run number in the horizontal axis. If more than one analysis of a particular control material is made in a run,
either the individual values or their mean value  can be used. The
chart is completed by horizontal lines derived from the normal distribution
N(μ,σ2) that is taken to describe the random variations in the plotted
values. The selected lines for control purposes are μ,
can be used. The
chart is completed by horizontal lines derived from the normal distribution
N(μ,σ2) that is taken to describe the random variations in the plotted
values. The selected lines for control purposes are μ,  (warning limits)
and
(warning limits)
and  (action limits).
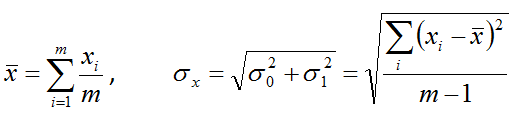
The parameters μ and σ0 are calculated as follows:
-
If a single replicate of control material in m consecutive runs, the running average is calculated as:
-
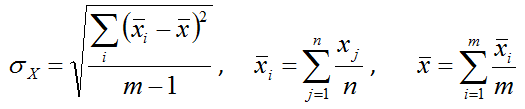
If n replicates of the control material are analysed in each consecutive m runs:
An out-of-control condition is signalled if any of the Westgard Rules occur:
- If the current value falls outside the action limits.
- Two out of three points in a row fall outside the warning limits.
- Nine consecutive plotting values fall on the same side of mean line.
- Six points in a row steadily increasing or decreasing.
- Fourteen points in a row alternating up and down.
- Four out of five points in a row between the limits
 and
and  or beyond.
 - Fifteen points in a row between the limits
 and
and  above and below mean line.
 - Eight points in a row on both sides of mean line with none between the limits and .