6.3.4 Scatter normalization
Scatter peaks provide information on the matrix of the sample.
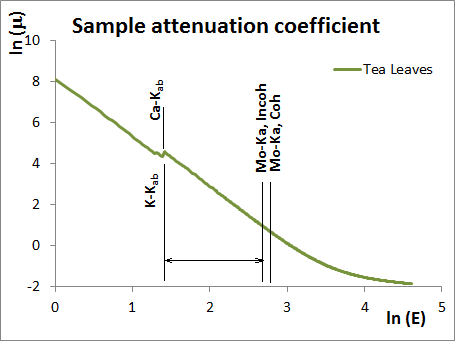
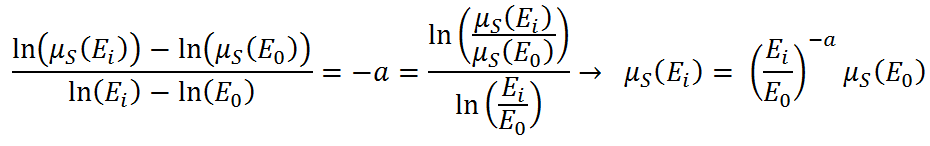
A thorough look at the sample attenuation coefficient allows concluding that the natural logarithm of the sample attenuation coefficient values for any of the excitation energy scatter peaks are linearly proportional to those of any characteristic energy emission lines beyond the last significant absorption jump in the sample.
For all of the emission lines in that region, the following derivation can be made for the case of infinite thickness samples under monochromatic excitation:
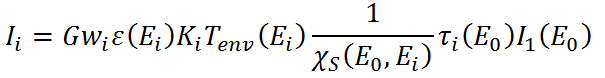
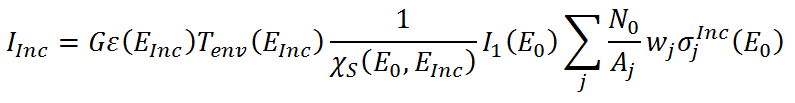
and for the incoherent scatter, using the total incoherent scatter cross sections σjInc(E0):
The normalization of the characteristic emission intensity to that of the scatter results in:
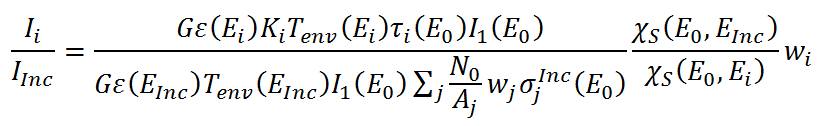
χS(E0,Ei) can be rewritten as

and based on the shape of μS(E) it is easy to prove that
Then the normalized intensity can be expressed as
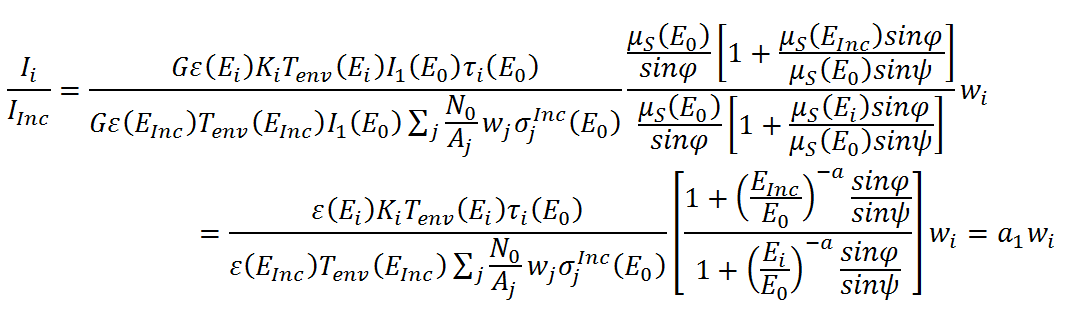
As one of the conditions assumed is that wi < 0.01 (otherwise there would be a significant absorption
edge for the element i !), and therefore its contribution to scatter 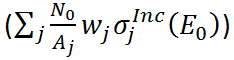 is negligible, this expression is linearly proportional to the concentration of the element wi, and does
not depend neither on the excitation flux nor on sample attenuation. A linear calibration can be made for
each element based on the measurement of reference materials with similar matrix (e.g. soils or sediments).
is negligible, this expression is linearly proportional to the concentration of the element wi, and does
not depend neither on the excitation flux nor on sample attenuation. A linear calibration can be made for
each element based on the measurement of reference materials with similar matrix (e.g. soils or sediments).
A calibration based on scatter normalization can be implemented using the IAEA QXAS program "TXRF and Thin samples", using the option "normalization to scatter counts".