4.6 Estimation of peak area by basic fit procedure
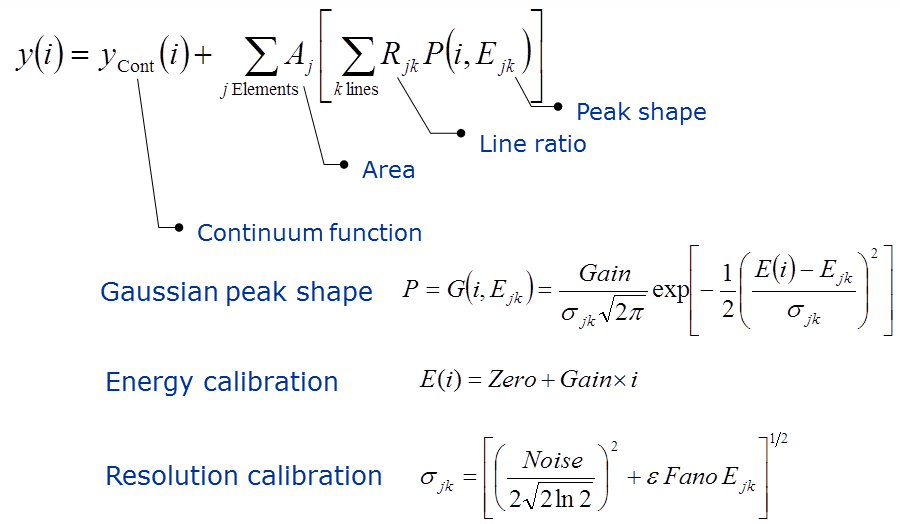
The detection process generates a signal with amplitude proportional to the energy of the photon, but with a spread in amplitude that results from the spectrometer energy resolution. Therefore, the counts registered in the spectrum for a given characteristic emission line are distributed around a channel centroid that correspond to the characteristic energy in the form of a peak. The best estimate of the total intensity of counts is given by the sum of all the counts within this spectral peak. As the peaks are superimposed on the continuum background radiation, the contribution of the continuum has to be subtracted from this sum to extract the peak net area.
There are different procedures to estimate the peak net area. When the total number of counts is large (e.g. a detectable peak) its population in the peak channels follows a Gaussian distribution. In that case, an unbiased estimate with a minimum variance can be obtained by using a non-linear least square fitting procedure, and as estimator of the quality of the fit the value of χ2 can be used.
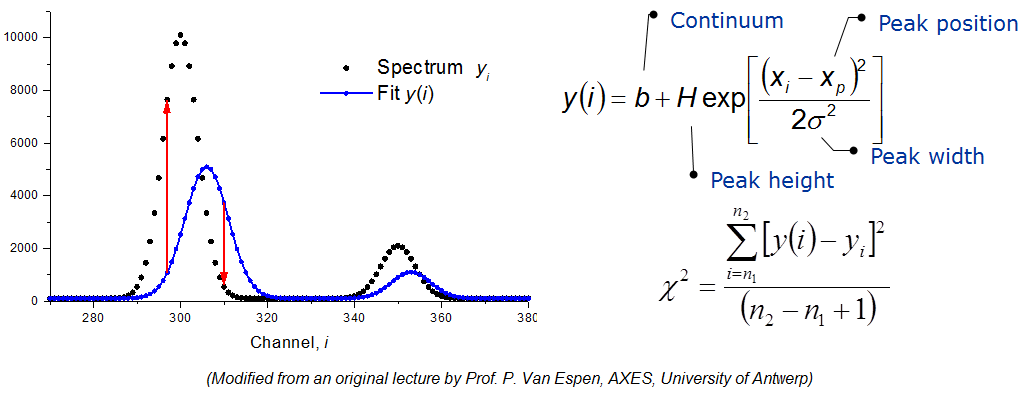
The fitting implies finding four parameters (Peak position, height and width plus the continuum). The fitting follows a converging algorithm in an iterative way until the minimum value for χ2 is found.
In the presence of multiple peaks, the procedure is more complex, since it implies finding 4 x N parameters (N = number of peaks). However, several parameters can be estimated from the calibration of the measurement, which includes energy calibration (energy vs channel number) and resolution calibration (change in resolution with energy).