8.2.3 Exploration of spatial variability
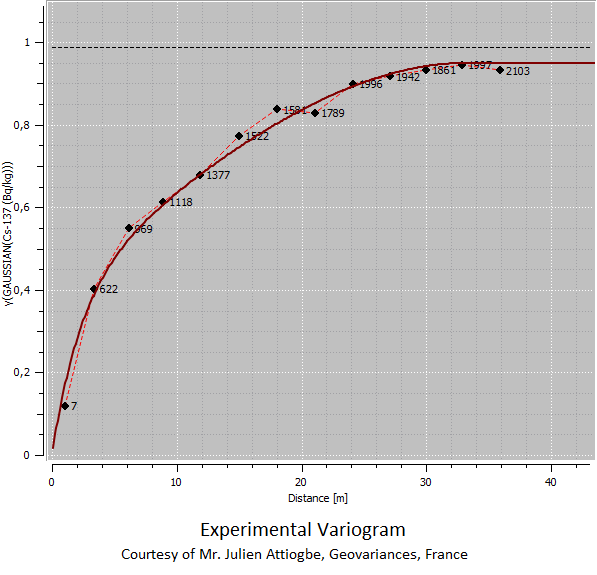
Experimental variograms represent the variability of the measurement values according to the distance between each pair of data points. Such dependence can be used to infer some information from the spatial structure of the data set which describes the phenomenon, if there is one present. Several scale structures may be identified, depending on both the extent of the contamination and the investigated site.
The variogram can be also used to assess if an adequate sampling plan has been performed. The knowledge of the data variability can be improved if additional measurements are performed, in order to smooth as much as possible the trend of the spatial structure. Attention has to be paid specifically for variability at small scale as it will strongly impact interpolation results.
The variogram cloud sometimes needs to be inspected in order to analyze thoroughly the dataset, and to identify some outliers that may affect the spatial structure. Nugget effect (non-negligible variability at small scale) may come from not accurate location, probe statistical counting fluctuation (too short counting time), variation of measuring conditions (distance between probe and measured surface), variation of measured matrixes (with different background levels).